Property Inventory by Month & Year
Supply held steady at record depths
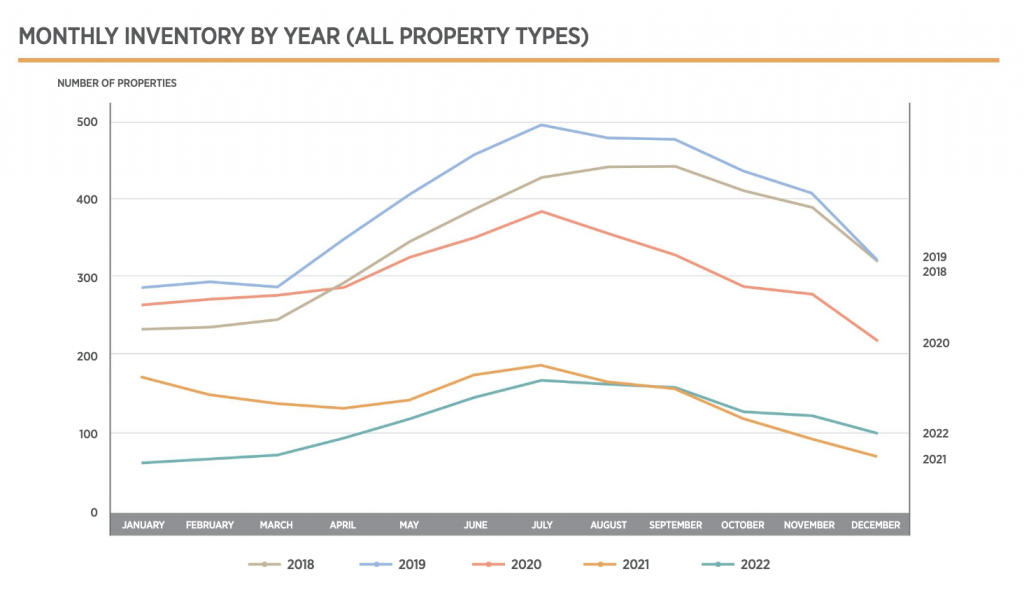
Nantucket is among many markets that saw a severe supply and demand imbalance over the last two and a half years. The sustained, historically low mortgage rates of 2020-2021, robust economic conditions, and the mass trend of remote work, burned supply to record depths. And although Nantucket property inventory data is not well documented prior to 2008, we are hard pressed to find a year-to-year inventory decline as significant as the one that occurred between 2020 and 2021. No other chart so clearly depicts why property values have soared, though we’d love to find a way to measure and superimpose buyer demand on here.
The nature of the island’s season-specific popularity contributes to an annual inventory profile that typically peaks in July. For example, the average number of properties listed for sale at the end of July in the 2018-2020 period was 434. By July of 2021, this number plummeted to just 183 properties thanks to the 842 property sales that took place from July 2020 to July 2021. And, the rest, they say is history — inventory levels really haven’t changed much since. Measuring slightly less than the previous summer, numbers for July 2022 came in at 166 properties.
The figures in this graph capture listing inventory for all property types (commercial, vacant land, condos/co-ops/multi-family) so isolating any category paints a more dire picture for buyers. As of July 31, 2022, the total number of single-family homes available for sale was 134. By year’s end it fell to 73. The good news? The 73 listings are 20 more than we saw at the end of 2021. For vacant land, there were 12 listings at the end of the year, an increase from the five in 2021. And commercial listings stood at eight listings, up from five in 2021.