
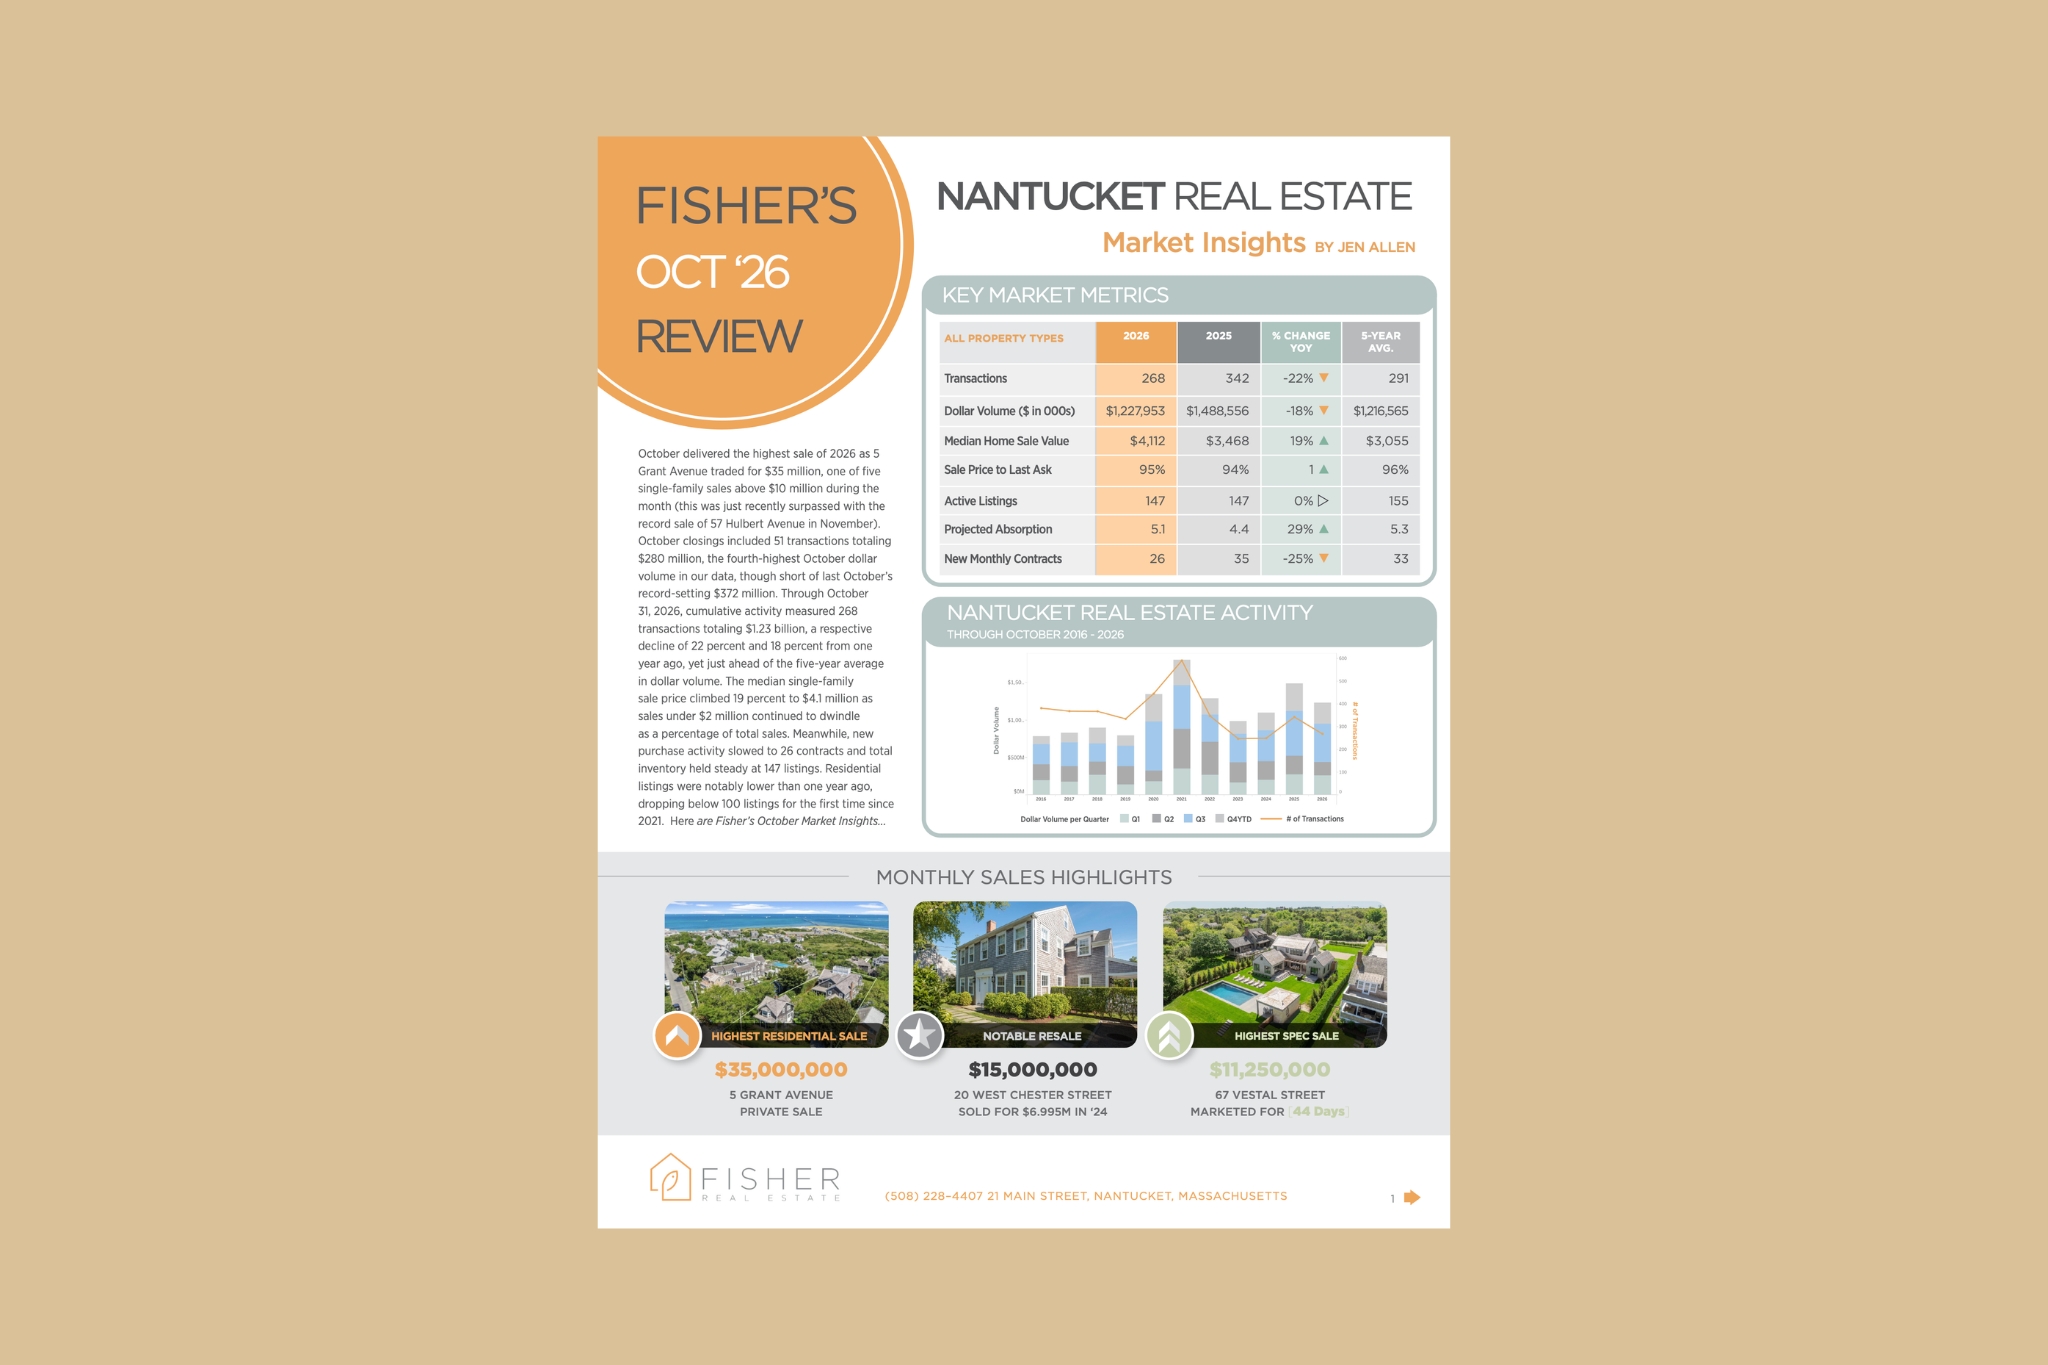
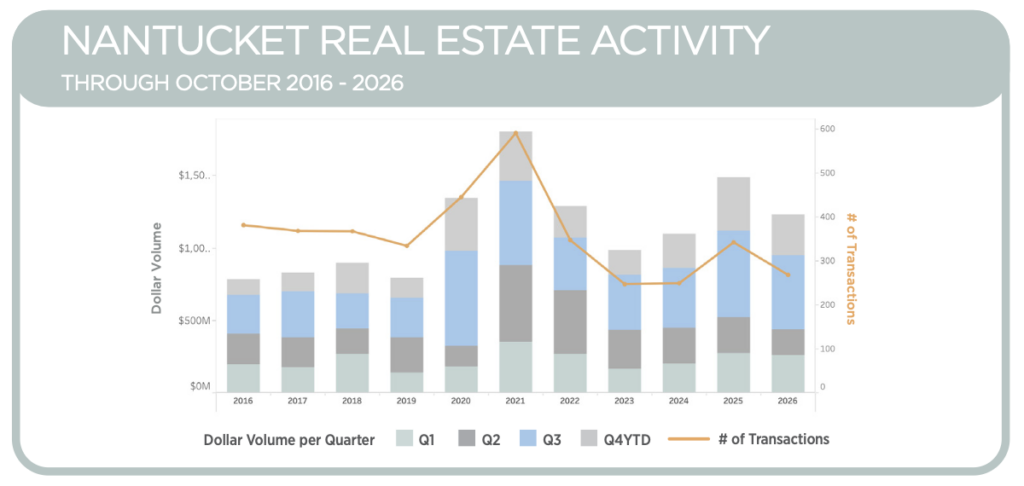
“October delivered the highest sale of 2026 as 5 Grant Avenue traded for $35 million, one of five single-family sales above $10 million during the month (this was just recently surpassed with the record sale of 57 Hulbert Avenue in November). October closings included 51 transactions totaling $280 million, the fourth-highest October dollar volume in our data, though short of last October’s record-setting $372 million. Through October 31, 2026, cumulative activity measured 268 transactions totaling $1.23 billion, a respective decline of 22 percent and 18 percent from one year ago, yet just ahead of the five-year average in dollar volume. The median single-family sale price climbed 19 percent to $4.1 million as sales under $2 million continued to dwindle as a percentage of total sales. Meanwhile, new purchase activity slowed to 26 contracts and total inventory held steady at 147 listings. Residential listings were notably lower than one year ago, dropping below 100 listings for the first time since 2021.”
Here are Fisher’s October Market Insights… from Jennifer Shalley Allen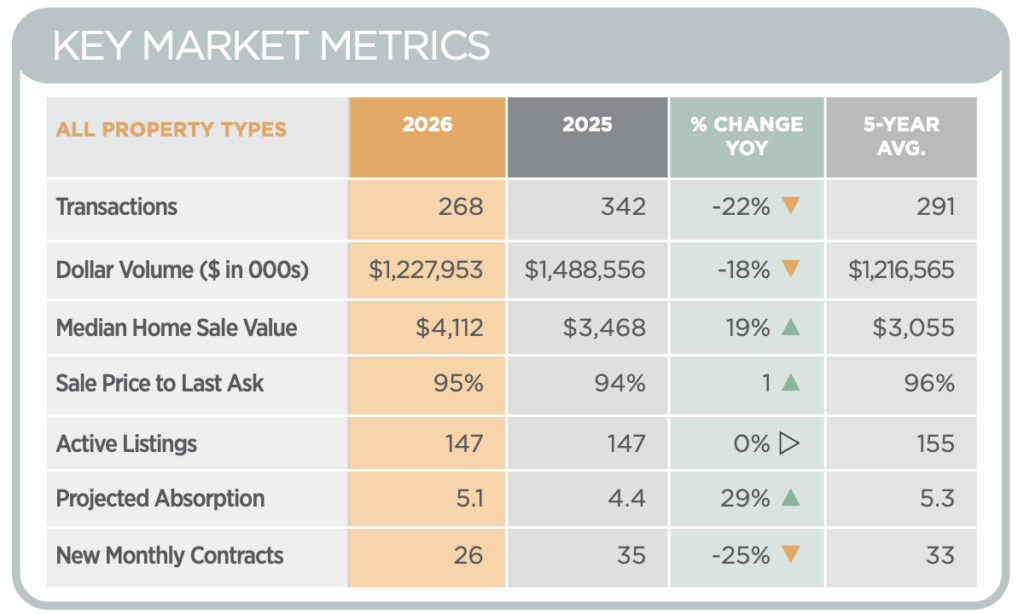

RESIDENTIAL SALES ANALYSIS
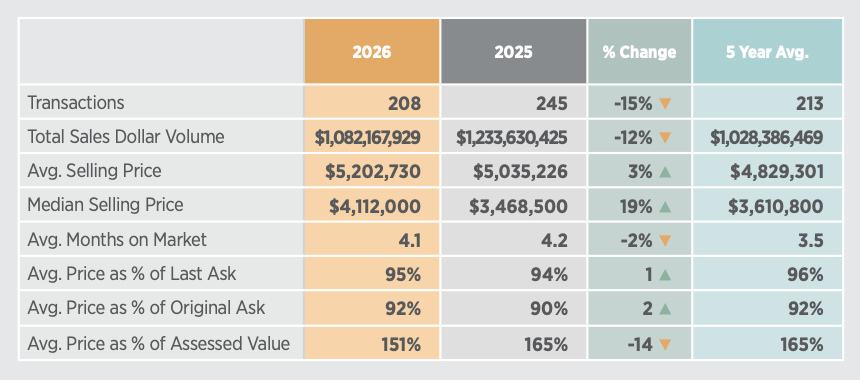
• Single-family home sales (excluding condos, coops & 40B or covenant properties) totaled 43 transactions and $258 million in October, down 22 percent and 26 percent from last October’s record-setting month. Year-todate sales of 208 homes totaling $1.08 billion trail 2025 by 15 percent and 12 percent but are five percent ahead of the five-year average in dollar volume.
• The gap is almost entirely at the ultra-high end: 17 sales above $10 million totaling $257 million versus 26 totaling $419 million in 2025. Excluding these, single-family dollar volume is $10 million ahead of last year.
• October standouts included 5 Grant Avenue at $35 million (last sold for $26 million in 2024), 94 Main Street at $15.25 million, the third-highest intown sale in our records, and the $11.25 million speculative sale of 67 Vestal Street.
SINGLE FAMILY HOME SALES BY PRICE POINT
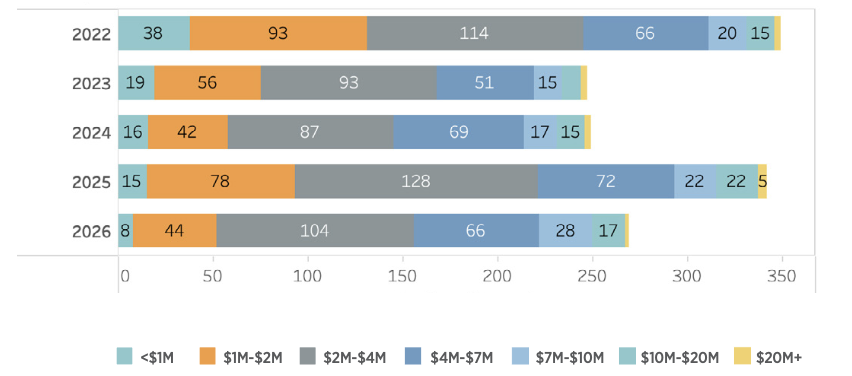 • The median single-family sale price was $4.1 million as of October 31, 2026, 19 percent higher than one year ago and 14 percent above the five-year average. The rise largely reflects the shrinking share of sales under $2 million, just nine percent of home sales so far in 2026 versus 18 percent in 2025 and over the five-year average. However, if you compare 2026 data to 2024, the median home sale is only four percent higher. This is because in 2025 there was a disproportionately higher number of sales between $1 million and $2 million compared to previous years.
• Sales between $4 million and $6 million rose to 24 percent of activity from 16 percent one year ago, and there were eight sales between $9 million and $10 million versus two in 2025. Homes sold at 95 percent of last asking price and 92 percent of original ask, both modestly better than 2025. The average marketing time of 4.1 months was nearly identical to one year ago, but both years are higher than the 3.5 months for the running five-year average marketing time.
PROPERTY INVENTORY & NEW CONTRACTS
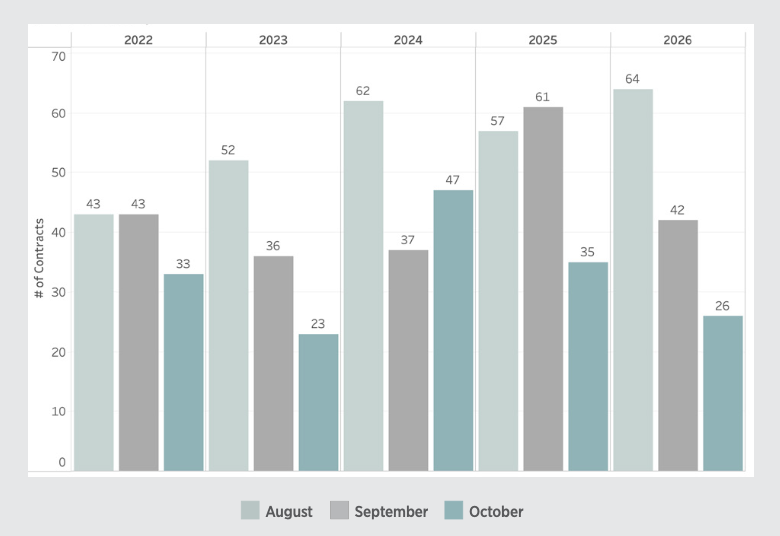
• As of October 31, 2026, there were 147 properties (residential, land & commercial) listed for sale, the same as one year ago. Months’ supply (based on trailing 12-month sales) measured 5.1 months versus 4.4 in 2025, reflecting fewer sales rather than more listings. Single-family listings fell 13 percent to 99 homes while commercial listings rose to 20 from five.
• Price adjustments were slightly higher, with 23 listings reduced in October compared to 20 one year ago. The average adjustment in October was a 9.4 percent reduction in the listing price.
• October brought 26 new purchase contracts, 25 percent fewer than one year ago, and below the five-year average of 33. Most were for properties last priced between $3 million and $4 million (38%) or $2 million and $3 million (31%), with one above $10 million.