January 18, 2023
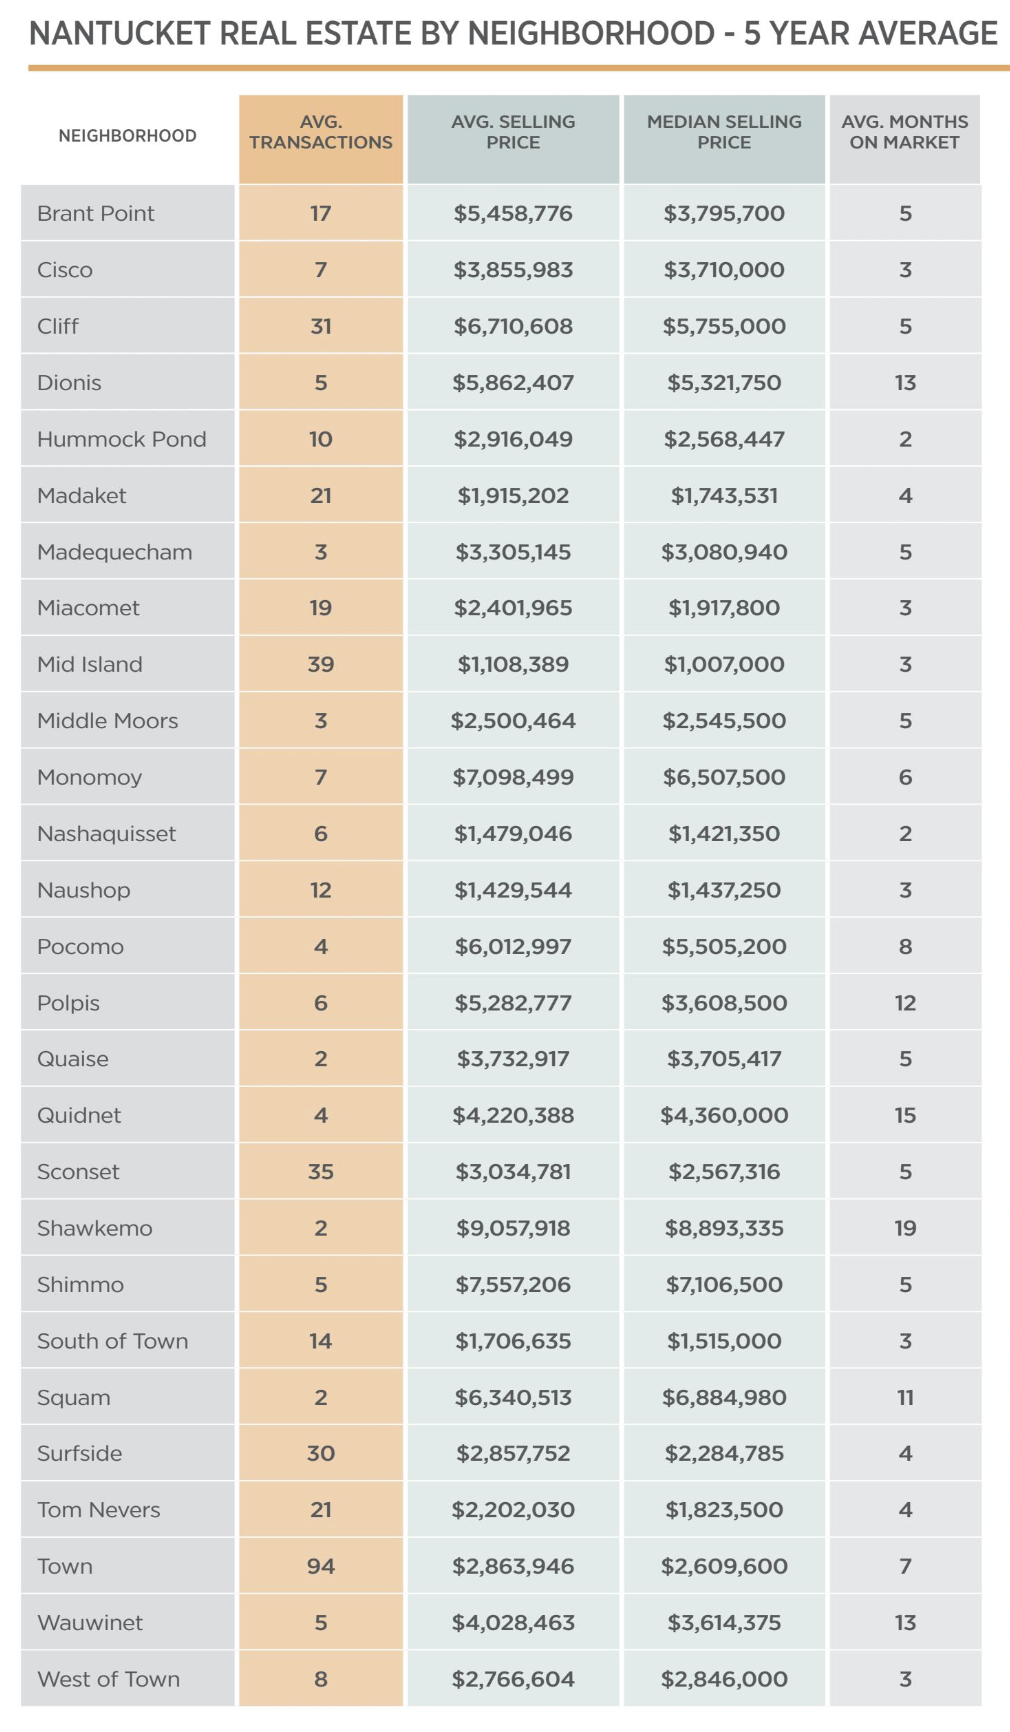
NANTUCKET REAL ESTATE BY NEIGHBORHOOD – 5 Year AVERAGE
| AVERAGE TRANSACTIONS | AVERAGE SELLING PRICE | MEDIAN SELLING PRICE | AVERAGE MONTHS ON MARKET | |
| Brant Point | 17 | $5,458,776 | $3,795,700 | 5 |
| Cisco | 7 | $3,855,983 | $3,710,000 | 3 |
| Cliff | 31 | $6,710,608 | $5,755,000 | 5 |
| Dionis | 5 | $5,862,407 | $5,321,750 | 13 |
| Hummock Pond | 10 | $2,916,049 | $2,568,447 | 2 |
| Madaket | 21 | $1,915,202 | $1,743,531 | 4 |
| Madequecham | 3 | $3,305,145 | $3,080,940 | 5 |
| Miacomet | 19 | $2,401,965 | $1,917,800 | 3 |
| Mid Island | 39 | $1,108,389 | $1,007,000 | 3 |
| Middle Moors | 3 | $2,500,464 | $2,545,500 | 5 |
| Monomoy | 7 | $7,098,499 | $6,507,500 | 6 |
| Nashaquisset | 6 | $1,479,046 | $1,421,350 | 2 |
| Naushop | 12 | $1,429,544 | $1,437,250 | 3 |
| Pocomo | 4 | $6,012,997 | $5,505,200 | 8 |
| Polpis | 6 | $5,282,777 | $3,608,500 | 12 |
| Quaise | 2 | $3,732,917 | $3,705,417 | 5 |
| Quidnet | 4 | $4,220,388 | $4,360,000 | 15 |
| Sconset | 35 | $3,034,781 | $2,567,316 | 5 |
| Shawkemo | 2 | $9,057,918 | $8,893,335 | 19 |
| Shimmo | 5 | $7,557,206 | $7,106,500 | 5 |
| South of Town | 14 | $1,706,635 | $1,515,000 | 3 |
| Squam | 2 | $6,340,513 | $6,884,980 | 11 |
| Surfside | 30 | $2,857,752 | $2,284,785 | 4 |
| Tom Nevers | 21 | $2,202,030 | $1,823,500 | 4 |
| Town | 94 | $2,863,946 | $2,609,600 | 7 |
| Wauwinet | 5 | $4,028,463 | $3,614,375 | 13 |
| West of Town | 8 | $2,766,604 | $2,846,000 | 3 |