RESIDENTIAL SALES SUMMARY
HIGH-END RESIDENTIAL SALES ANALYSIS
YTD Figures Approaching Previous Full-Year Totals
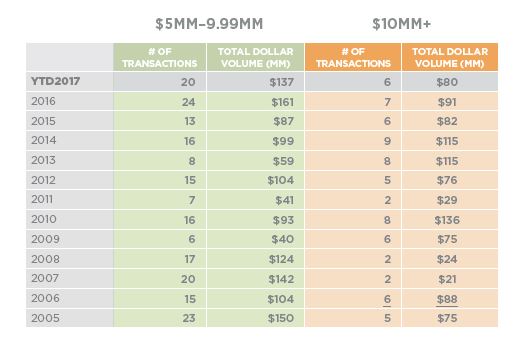
More than one-third of September’s dollar volume stemmed from five transactions in the high-end ($5MM-$9.99MM) and the ultra-high-end ($10MM+) of the market. In fact, through September 30, 2017, 20 transactions took place between $5 million and $9.99 million, a figure which surpassed the annual totals for every other year since 2006 barring 2016 (which is certain to be surpassed). Eight of these high-end transactions represented the sales of speculative properties, two more transactions than one year ago.
The six recorded ultra-high-end sales through September 30th weren’t as notable in the same comparative historic sense (yet), but with another quarter left to go and four ultra-high-end sales already on the books or marked under contract, 2017 is poised to pass all previous records for this segment of the market by year’s end. With this activity it is easy to see why year-over-year dollar volume is up even while transactions declined. It also helps explain the eight percent rise in the median sale value over the last 12 months.
SALES DISCOUNT ANALYSIS: MARKET AVERAGE VS. THE HIGHER END
Sales Discounts Show Interesting Pattern From 2006-2017
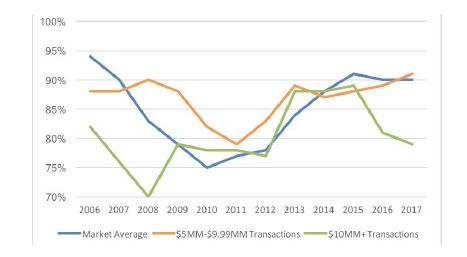
In reviewing the sales price to original list price of high-end and ultra-high-end sales, we noted a few interesting items when comparing the transactions to the market average. During the last eleven years, the average sale price to original list price for all properties across every price point was 90 percent. The high-end averaged 87 percent and the ultra-high-end averaged 80 percent during the same period. Interestingly, if the period from 2008-2010 is excluded, the market average and the high-end average are identical at 88 percent, suggesting high-end properties fared better during the market’s downturn. Otherwise the high-end trades close to the market’s average.
It’s more difficult to draw conclusions from the historic patterns in the ultra-high-end as this segment is more naturally affected by outliers. For instance, there were two years during which there were only two transactions in this price point (compared to a minimum of 8 transactions for the high-end during this period). One grossly mispriced transaction can therefore greatly influence the average. This segment of the market has also been influenced by relatively limited demand and more healthy supply. For instance, during the last three years, there has been an average of 26 properties listed for sale over $10 million with an annual average transaction rate of just seven. It seems there may be more negotiating room based on these dynamics (and perhaps also some mispricing) in this segment of the market.