2025: The Reacceleration of the Nantucket Real Estate Market
For the five years preceding 2020, Nantucket real estate activity was largely consistent from year to year. Annual transactions averaged around 450 property sales, totaling near $1 billion in dollar volume. This steady pattern was disrupted during the pandemic peak when transactions skyrocketed from 423 sales in 2019 to 732 sales in 2021 and dollar volume surged handily past $2 billion.
Between 2023-2024, transactions cooled to around 300 annual sales, while property values marginally improved upon their sizable gains from 2021-2022, keeping total dollar volume at impressive figures. The 2025 market marked a reacceleration of activity across the island. Every segment of the market, including residential properties, commercial properties and vacant land, experienced double-digit transaction growth. For the first time since 2021, transactions surpassed 400, approaching pre-pandemic norms.
On a broad-market basis, property values held firm at their post-pandemic valuation levels with the average sale value of all property types holding steady from 2024 at $4.3 million. Marketing times lengthened marginally but that was largely due to a few outlier transactions with most sales taking place in less than four months. Although the year began with higher inventory than any of the prior four years, by the third quarter buyers were firmly engaged, eagerly absorbing new inventory. By year’send, inventory levels had returned closer to those seen in 2022.
As we look to 2026, we anticipate that Nantucket real estate will see another efficient year of active buyers and stable to rising pricing. Of course, the market will need the inventory to support another year of 400+ transactions, but it appears the mentality of both sellers and buyers will be conducive to more transaction activity than we saw in 2022- 2023.
Let’s dive into the data… Jen Shalley Allen, Principal Broker


THE BIG PICTURE: 2025
Each year, we aim to summarize the most consequential issues shaping Nantucket’s real estate market. Later in this report, our team explores many of these topics in greater detail. Below is a high-level overview of the factors we believe are having, or may soon have, the greatest impact on property values.
SHORT TERM RENTAL (STR) CLARITY
After nearly six years of debate, island voters formally legalized short-term rentals by codifying them within Nantucket’s zoning code. A longstanding and divisive issue, uncertainty around whether STRs would be permitted (and under what restrictions) created ambiguity for future property values. While opinions differ on how STR regulations ultimately affect pricing, the 2025 vote has, at least temporarily, brought clarity heading into the 2026 season. That said, the issue is likely far from settled. At the time of this report, an appeal has been filed requesting that the Massachusetts Attorney General deny approval of the island’s vote.
INCREASING BOARD OF HEALTH (BOH) STRINGENCY
Few regulatory bodies have as much influence over Nantucket real estate values as the Board of Health. Recent proposed septic regulations in the Hummock Pond watershed and wellhead protection districts could significantly impact property values by restricting buildability. These proposals include stricter requirements for system upgrades, inspections, and, most notably, septic system sizing, which could be limited to one bedroom per 10,000 square feet of land. While variances have historically allowed for larger systems, that precedent could change abruptly. For example, a 20,000-square-foot lot limited to a two-bedroom septic system would materially affect development potential and value. If adopted, similar regulations could eventually be proposed in other areas of the island, particularly where sewer infrastructure is unlikely. We will monitor this closely in 2026 and encourage clients to attend or listen in on public hearings.
DEMAND FOR PROPERTIES IN CN/CTEC/RC-2 ZONING
This topic warrants a deeper dive in a follow-up report, but it is worth noting the increasing demand for commercially zoned land. With limited acreage designated for commercial use and a growing number of businesses seeking space to support the island’s expansion, vacant parcels in these zones are appreciating rapidly. Broad estimates suggest land in these districts traded near $33 per square foot in 2012 and as high as $140 per square foot in 2025. Given finite supply and rising demand for zoning flexibility, we expect this trend to continue.
Cumulative Real Estate Sales & Transaction Volume
After two years of comparatively muted transaction and dollar volume following the market’s peak in 2021 and a solid year in 2022, Nantucket real estate saw a pronounced rebound in 2025. Transactions pushed past 400 property sales for the first time since the peak, and dollar volume tallied its third highest total in island history, thanks not only to the increase in transactions but also to elevated property values in the post-pandemic era.
While market activity followed its typical seasonal crescendo, the second half of the year packed a huge punch with the third and fourth quarters posting roughly double the transaction activity of the first and second quarters. The 270 transactions posted in the second half of the year were materially higher than any quarter since 2022 such that by year’s end, there were 417 transactions totaling $1.81 billion on the books, a respective increase of 34 percent for both metrics from 2024.
Interestingly, for the first time in several years, the average sale value of all property types held steady from 2024, indicating that the increase in dollar volume stemmed more from an increase in buyer confidence and transaction activity than it did from price appreciation or an overcharged luxury market.

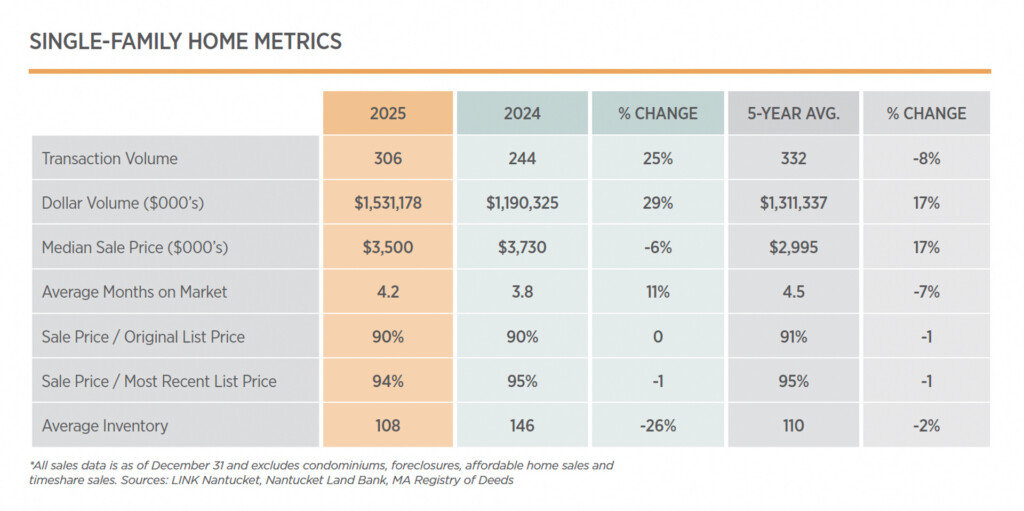
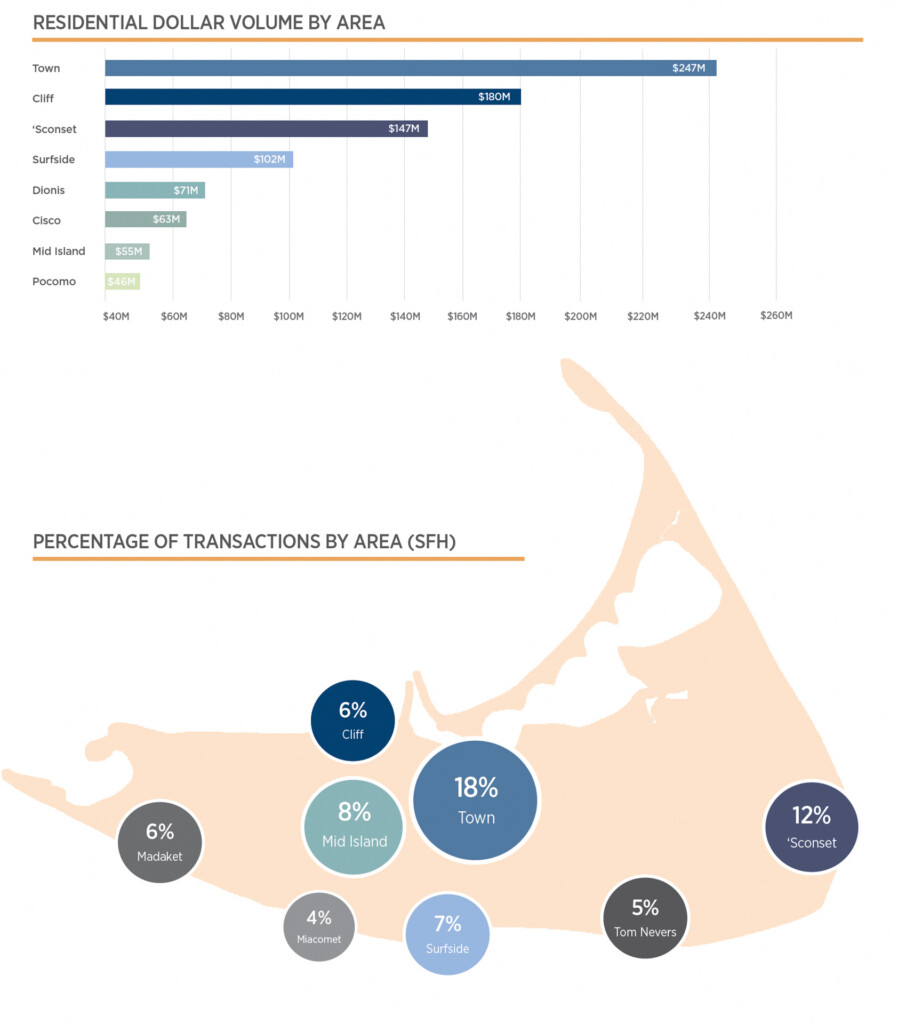
Single-Family Home Sales Overview
Single-family home sales on Nantucket exceeded 300 transactions annually from 2014 through 2021. This streak ended in 2022, when sales fell sharply from 475 transactions in 2021 to just 286. Thanks in part to the lowest housing inventory of all time, the lowest transaction figures were set in 2023 when just 219 home sales took place across the island.
In 2024, inventory increased for the first time in several years, and sales activity followed. That momentum carried into 2025, as both inventory and transactions continued to rise, with single-family home sales surpassing 300 transactions for the first time since 2021.
Seasonal inventory peaked earlier than usual in June (rather than the typical July high) with 198 homes listed. This represented a 10 percent increase year over year and marked the highest June inventory level since 2020. Unlike the prior two years, increased inventory coincided with a meaningful pickup in contract and closed-sale activity, allowing 2025 transaction totals to outpace both 2023 and 2024. Buyers readily absorbed the additional supply, with the third and fourth quarters posting notable gains in transaction volume compared to the previous three years.
Compared to 2024, sales discounts widened slightly, and marketing times lengthened for the second time in five years. Despite this, full-price offers increased by 18 percent after declining in 2024, and above-asking-price offers rose by 16 percent. This indicates that disciplined pricing aligned with buyer expectations and allowed pent-up demand— constrained for years by limited inventory—to reemerge.
Average single-family home prices posted modest, single-digit gains in 2025, while the median sale price declined. Whether driven by stable pricing, modestly improved mortgage rates, or both, buyer urgency increased, as evidenced by a 16 percent rise in homes selling within 30 days. If inventory levels are sufficient to support demand in 2026, the market may once again shift toward upward price pressure.
Single-Family Homes Sales by Price Point
Entry Level: Under $2M
The sub-$2 million segment, now defined as entry-level properties, represented 17 percent of all single-family sales in 2025, up modestly from 2024, despite limited inventory. As a point of refence, in 2019, this segment of the market represented 56 percent of all sales. Six years later, demand outweighs supply so significantly that it is the most competitive and fastest selling segment of the market with often less than one month to zero months of supply and near immediate absorption when listings come to the market. Not only are traditional buyers competing for homes in this price point, but in recent years many island businesses and non-profits have also entered the arena to secure workforce housing.
Lower Mid-Market: $2M-$3M
Single-family home sales between $2 million and $3 million represented approximately one quarter of 2025 activity. Absorption in this price segment improved meaningfully from 2024, with homes selling 35 days faster, suggesting buyers were less cautious, making faster decisions than one year earlier. Unlike properties priced for less than $2 million, inventory in this price point remained at year’s end (representing approximately half of the peak amount in June/July) indicating a more balanced seller/ buyer dynamic in this segment.
Core Market: $3M-$5M
The $3 million to $5 million price range formed the core of the 2025 market in that it represented the largest share of transactions at 28 percent of total activity. This segment also reflects the 2025 median home sale price of $3.5 million. This percentage of transaction activity is nearly identical to 2024 (30%) but 10 percentage points higher than in 2019 illustrating the growth in this segment over time. At close to six months, the average marketing time for homes in this price range is slightly longer than the previous two price points, but it shortened the most of all price segments from 2024 pointing to stronger demand. Interestingly, transactions between $4 million to $5 million were one of only two price points to see a reduction in transaction activity from 2024. This does not appear to be due to constrained inventory given levels were consistent year to year so it’s likely that the available inventory did not meet buyer value expectations.
Luxury Market: $5M+
We dive into this segment in more detail on the following pages but, as to be expected, this portion of the market was the dominant force in boosting aggregate dollar volume. Combined, properties over $5 million represented 32 percent of annual transaction activity but generated more than 60 percent of all single-family dollar volume in 2025. While the sheer number of transactions in this segment increased compared to 2024, the percentage of total transactions in the luxury market saw a modest reduction.

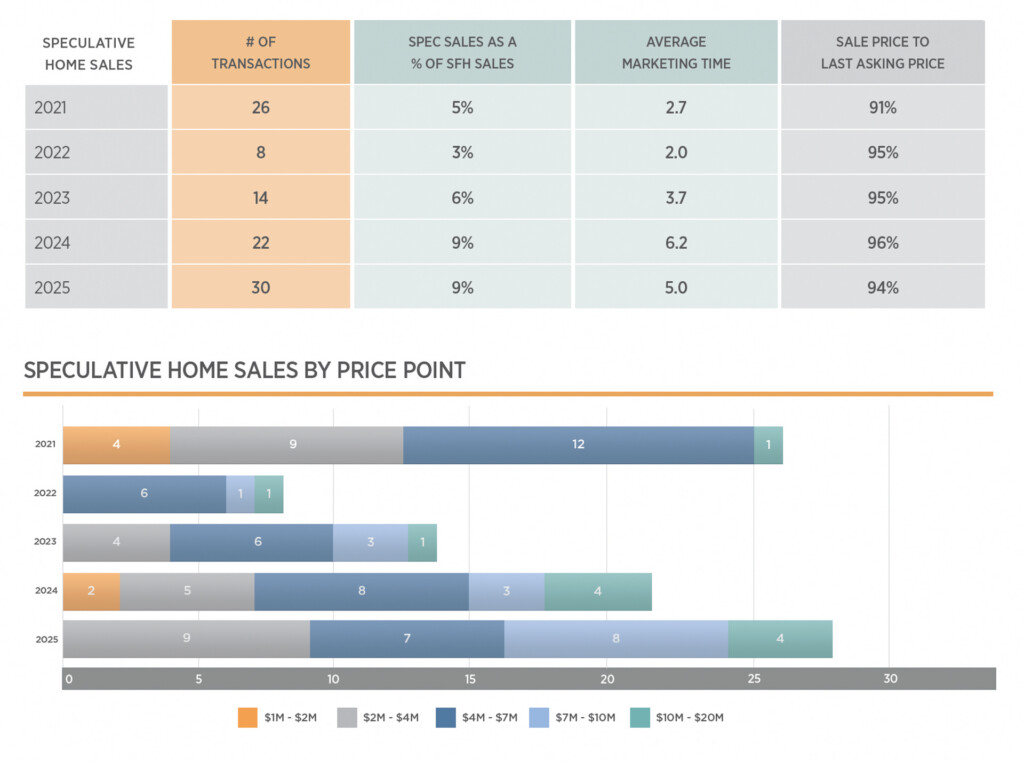
Speculative Home Sales Metrics
Fisher’s records indicate that 30 speculative home sales closed on Nantucket in 2025, totaling $185 million. This represents a 36 percent increase in transactions and a 44 percent rise in dollar volume compared to 2024. The average sale price for speculative homes increased from $6.25 million in 2024 to $6.5 million in 2025. For context, the average speculative sale price was approximately $4 million in 2020, reflecting appreciation largely in line with the broader market.
Average price per square foot rose from $1,325 in 2024 to $1,500 in 2025. Sales ranged from roughly $600 per square foot for properties in the Sandpiper Place neighborhood off Old South Road to as high as $3,000 per square foot for a comprehensive renovation on Main Street.
Speculative sales accounted for nine percent of all single-family home transactions in 2025. While this marks a meaningful rebound from the 2022 low, it remains below pre-pandemic levels, when speculative homes represented approximately 11 to 13 percent of annual sales. Shortening average marketing times for these turnkey properties suggest buyer demand remains solid. However, rising material and labor costs, combined with constrained inventory, are likely to limit developers’ ability to meet demand in 2026, making significant growth in this segment unlikely.
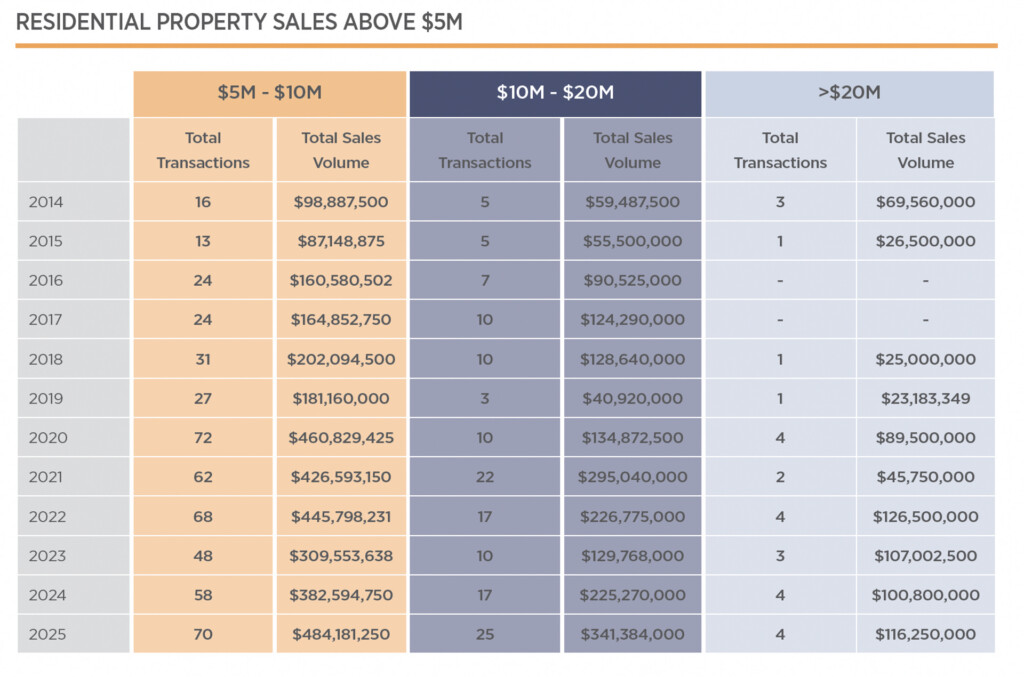
Luxury Market Overview
Mirroring the broader market, Nantucket’s luxury segment, defined as home sales above $5 million, recorded higher transaction and dollar volume in 2025 than in the prior two years. The $5 million to $10 million price range experienced strong year-over-year growth, posting its highest transaction count since 2020. Within this tier, the most notable increase occurred in the $7 million to $8 million segment, where transactions nearly doubled from nine sales in 2024 to 17 in 2025. Four of these transactions involved buyers purchasing speculative homes.
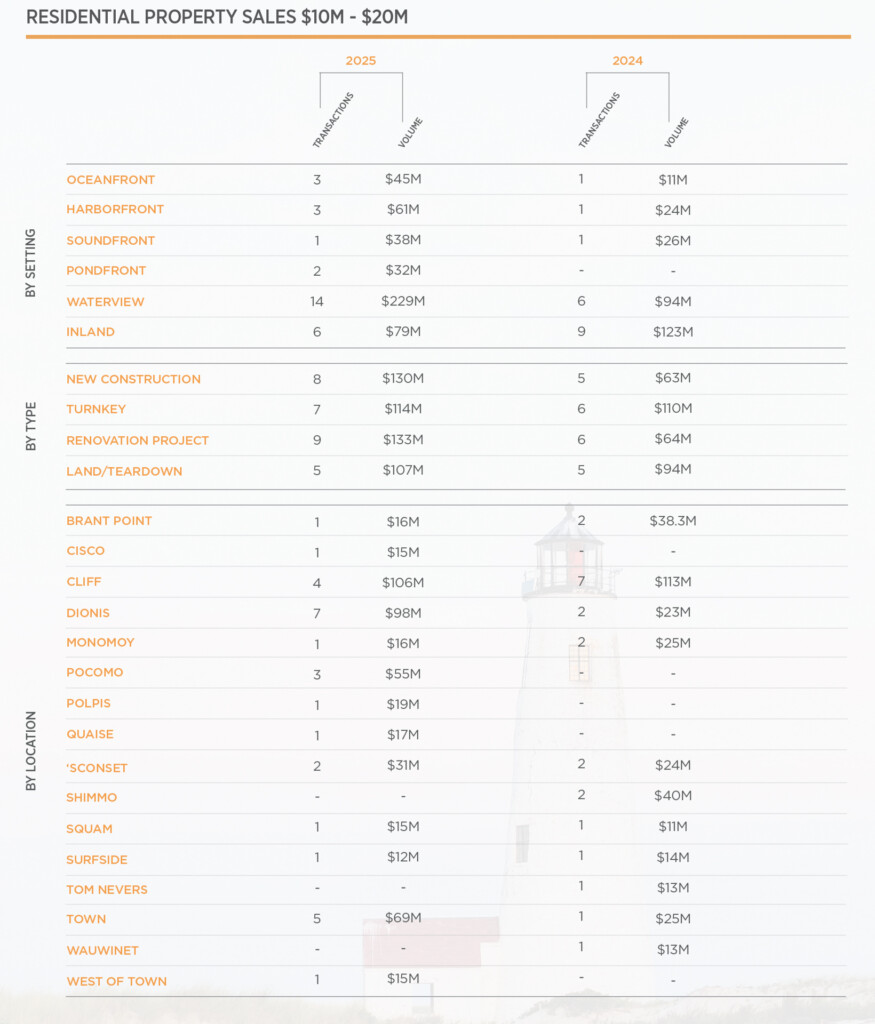
The $10 million to $20 million segment recorded the highest transaction count in island history, capturing an eight percent market share in 2025. While noteworthy, this increase largely reflects the broader upward repricing of Nantucket real estate driven by the wealth effect of recent years. Over the same period, the S&P 500 has risen approximately 80 to 100 percent, depending on precise timing. Similarly, properties that once traded near $5 million now often command prices closer to $10 million. In this context, increased luxury-market transaction volume is largely expected.
At the mega-high end of the market, or sales exceeding $20 million, transaction activity remained limited, consistent with the scarcity of available inventory at this level. The few transactions that occurred involved highly unique offerings, including two waterfront properties, a Lincoln Circle estate, and a comprehensively renovated home with water views and nearby beach access. Only one of these properties was publicly marketed through the MLS; most transactions in this segment occur off market.
The following page offers insight into the property attributes of Nantucket’s luxury home sales.

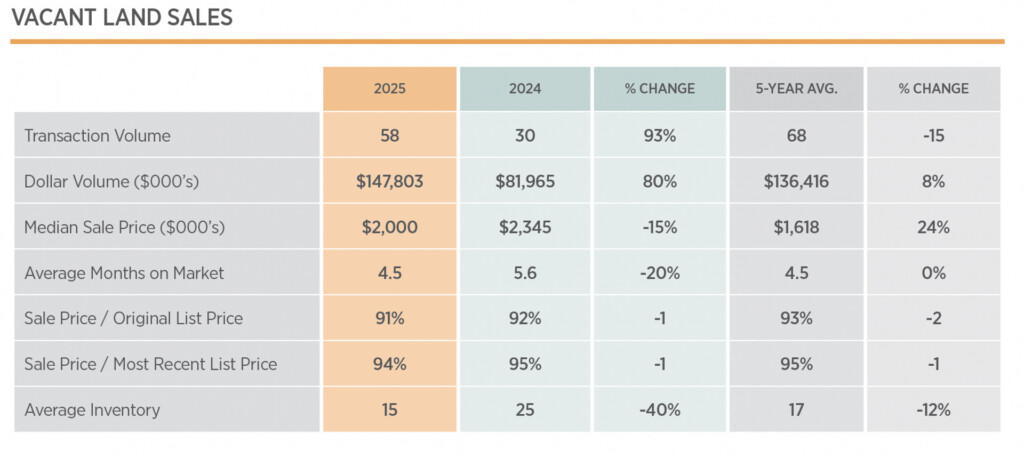
Vacant Land Sales Overview
Similar to single-family home and commercial property sales, vacant lot sales also rebounded from 2024 figures. Through December 31, 2025, vacant land sales measured 58 transactions totaling $148 million, a respective increase of 93 percent and 80 percent from one year earlier, though still notably below the five-year average on a transaction figure basis.
Land characteristics vary drastically across the island and thus lot sales (as categorized in the MLS) ranged from $550,000 for an unbuildable piece of creek-front land in Madaket to the $9.375 million sale of a subdividable parcel in the Cliff area. The latter sale was technically marked as land in the MLS and would be perceived as land by most buyers, but there was an existing 1960’s structure on the property. This opens the age-old debate on what is truly categorized as a vacant land sale when there is an existing dwelling slated to be removed or demolished. So, in fact, by this lens, the highest land sale of 2025 is also the highest real estate transaction of the year, the $37.75 million sale of 3 Sherburne Way, which also has a 1960’s structure on the lot. It was marked as a residential sale in the MLS but in reality, it marks the highest land sale of all time on the island. A roughly similar and abutting property traded for $21 million in 2020.
Marketing times for properties categorized as land in the MLS ranged from a two-day marketing period for a half-acre parcel of land in ‘Sconset to 682 days for a 15,000 square foot parcel of Mid-Island land that ultimately sold for a four percent haircut from the initial list price despite the lengthier marketing time.
As a way to narrow in on property appreciation rates on the island, Fisher tracks property resale information. This is particularly insightful for vacant land transactions given there is a higher likelihood of no changes to the property between sales. There were three transactions in 2025 that shed light on underlying appreciation for land parcels that are truly vacant. The first was the resale of a parcel on Cannonbury Lane in ‘Sconset, which sold for an annualized return of 21 percent between transactions (excluding transaction costs). The second was a half-acre parcel on Maple Lane off of Fairgrounds Road, which sold with an annualized appreciation of 12 percent. Lastly, there was a notable lot resale in Tom Nevers within less than 30 days that resulted in a 854 percent return. The property retraded within two months from the previous sale and shows just how lucrative a return on vacant land can be and/or how easy it may be to underestimate a property’s value.
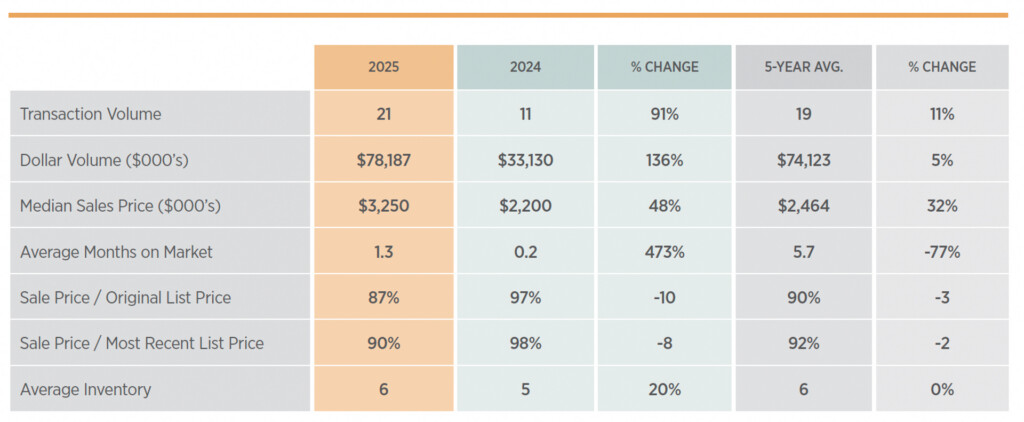
Commercial Property Sales Overview
Nantucket’s commercial sales represent a relatively small percentage (5 percent) of the overall real estate market. Occasionally, however, there are years where several notable transactions amount to a significant shift in the commercial landscape of the island — 2025 was one of them.
As of December 31, 2025, there were 21 transactions totaling $78 million, a respective increase of 91 percent and 136 percent from 2024, and on par with the five-year average of 19 transactions totaling $74 million. For perspective, the most recent “best” year for this segment of the market was in 2021 when there were 39 transactions totaling $216 million. Prior to 2020, there were typically 13-20 annual transactions.
Given the relatively limited number of transactions, the wide variety of property types and associated businesses, and the fact that many of the sales are private, it’s difficult to draw meaningful year-to-year comparisons in this part of the market. We therefore summarize the most notable transactions from 2025:
The highest sale of the year took place in April and was the $9.485 million sale of 5 North Water Street. The property includes two buildings totaling nearly 8,500 square feet on an oversized, corner lot in CDT zoning and had been the longtime home of White Heron Theater. The buyer, Nantucket Performing Arts Center, Inc., was a group of former board members of the White Heron Theatre.
The next highest commercial sale was the $6.5 million purchase of 17, 19, and 21 Boynton Lane by Nourish Nantucket and the Nantucket Land Bank. This transaction secured a long-term home for the Nantucket Food Pantry and will expand the island’s food security infrastructure.
The third highest commercial sale of the year was the $6.25 million sale of 30 Sparks Avenue, a mixed-use property home to Cumberland Farms and a residential unit above. The purchase was by an entity related to the family who owns the adjacent On Island Gas.
Other notable sales included the Nantucket Historical Association’s $6.1 million purchase of 91 Bartlett Road (to relocate its wood shop and expand operational space; the sale of Glyn’s Marine for $5.5 million to Blue Water Marinas, in partnership with Bain Capital Real Estate; the $2.2 million sale of 19 Washington Street by the Artists Association of Nantucket who then purchased 8 Federal Street for $3.5 million.
The lowest commercial sale of the year was the $800,000 transfer of a commercial condominium on Windy Way.
Annual commercial inventory peaked in June when there were 10 properties publicly listed for sale. By year’s end, there were just five properties listed in the MLS. For reference, the most recent peak for year-end, commercial inventory was the 18 properties listed in 2018. As we look to 2026, we already know there are a handful of notable sales pending in the restaurant space so it could be that we see another active, seller-transition year for commercial properties.
TOPICS OF NOTE FROM THE FISHER TEAM
TO READ THE FULL BLOGS VISIT: ACK.FISH/CURRENTTOPICS
OUR TEAM
Fisher Real Estate was created to elevate the way real estate is explored, discovered, and serviced. We see ourselves as stewards of an incredibly special place and take pride in raising the bar when it comes to showcasing the island’s unparalleled lifestyle and exceptional real estate.