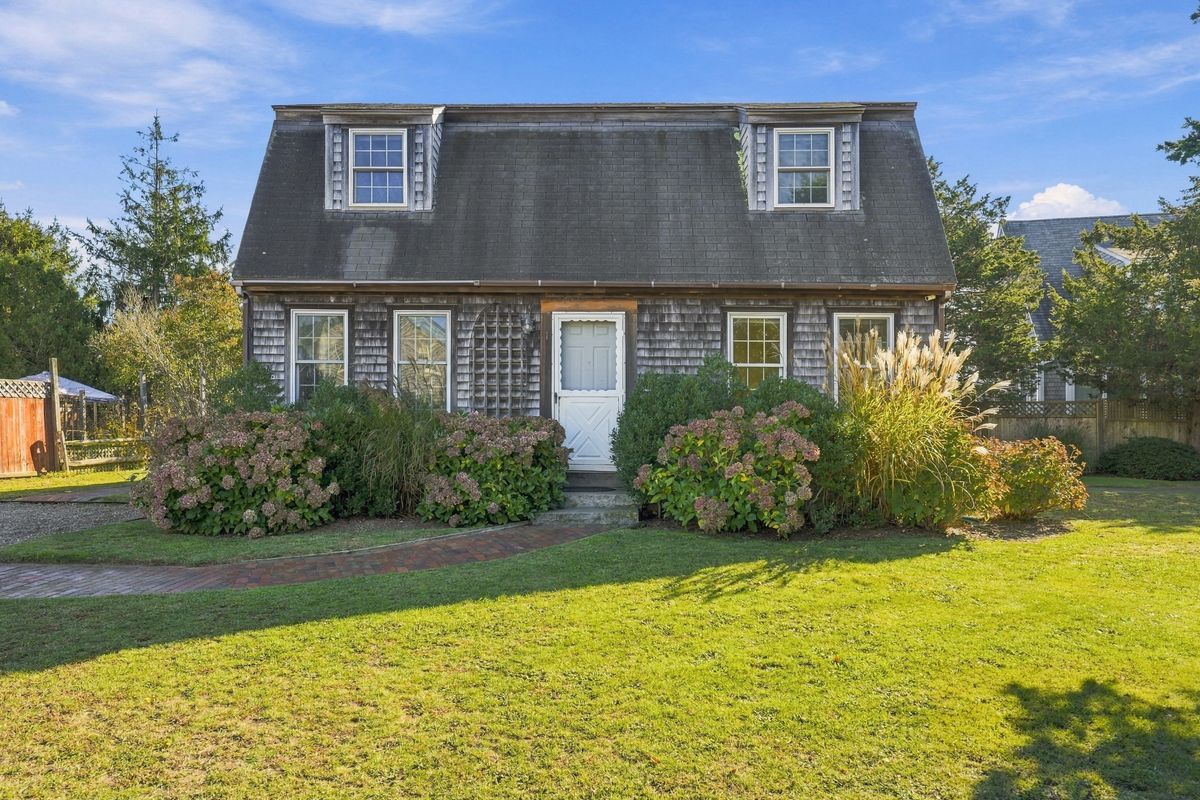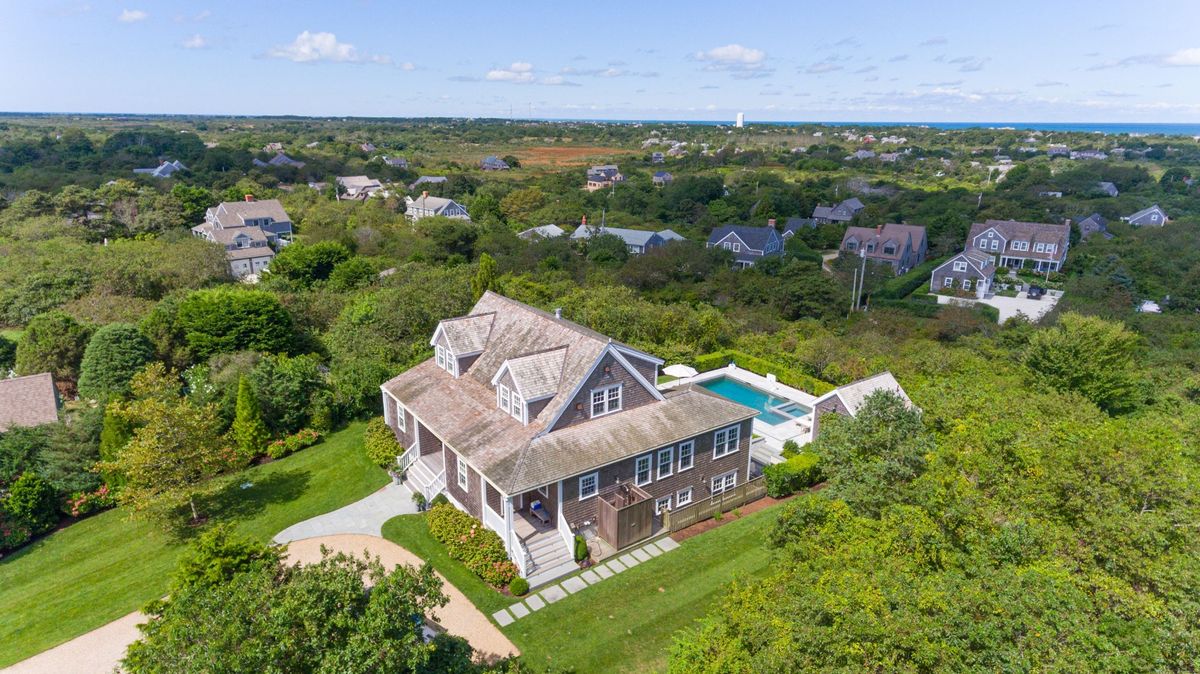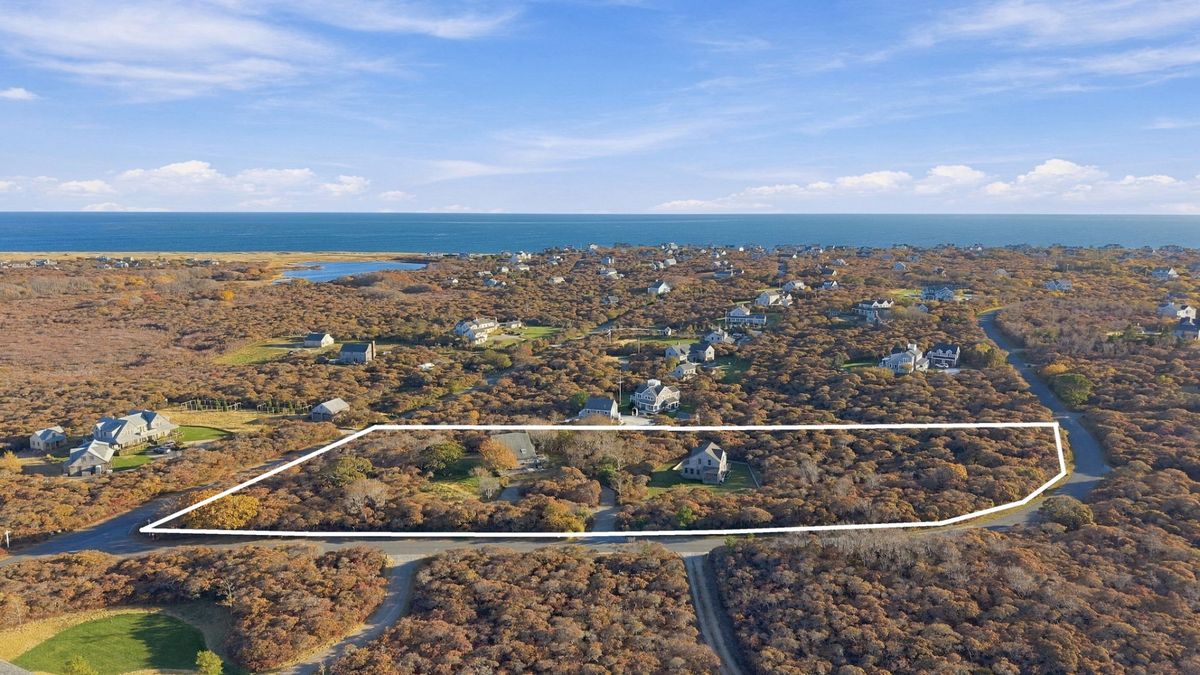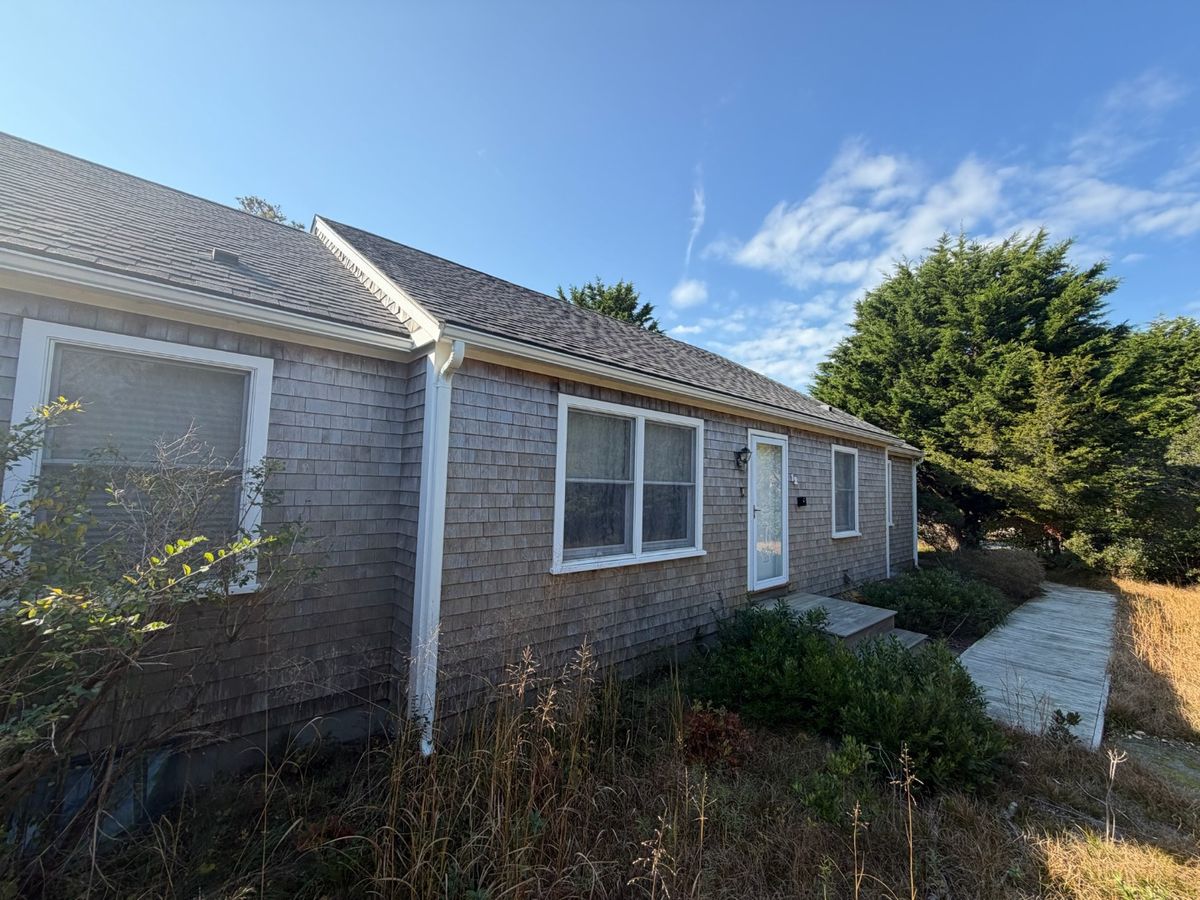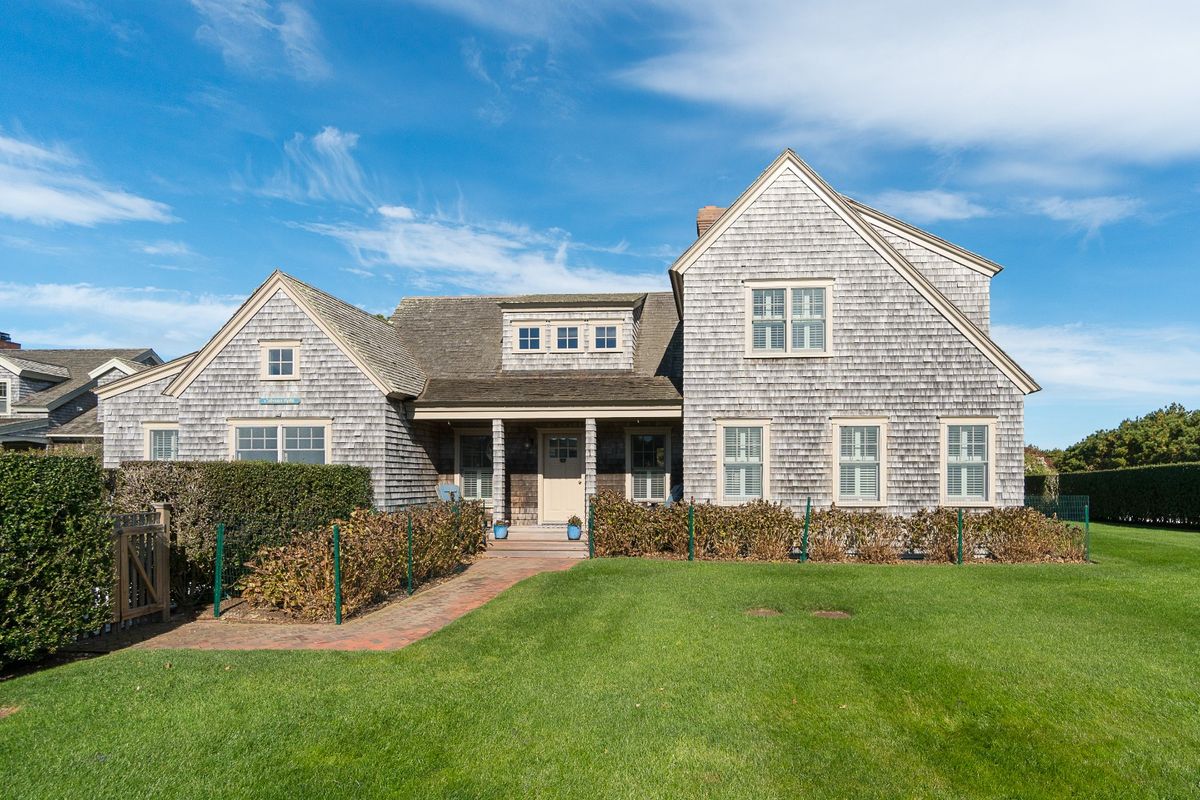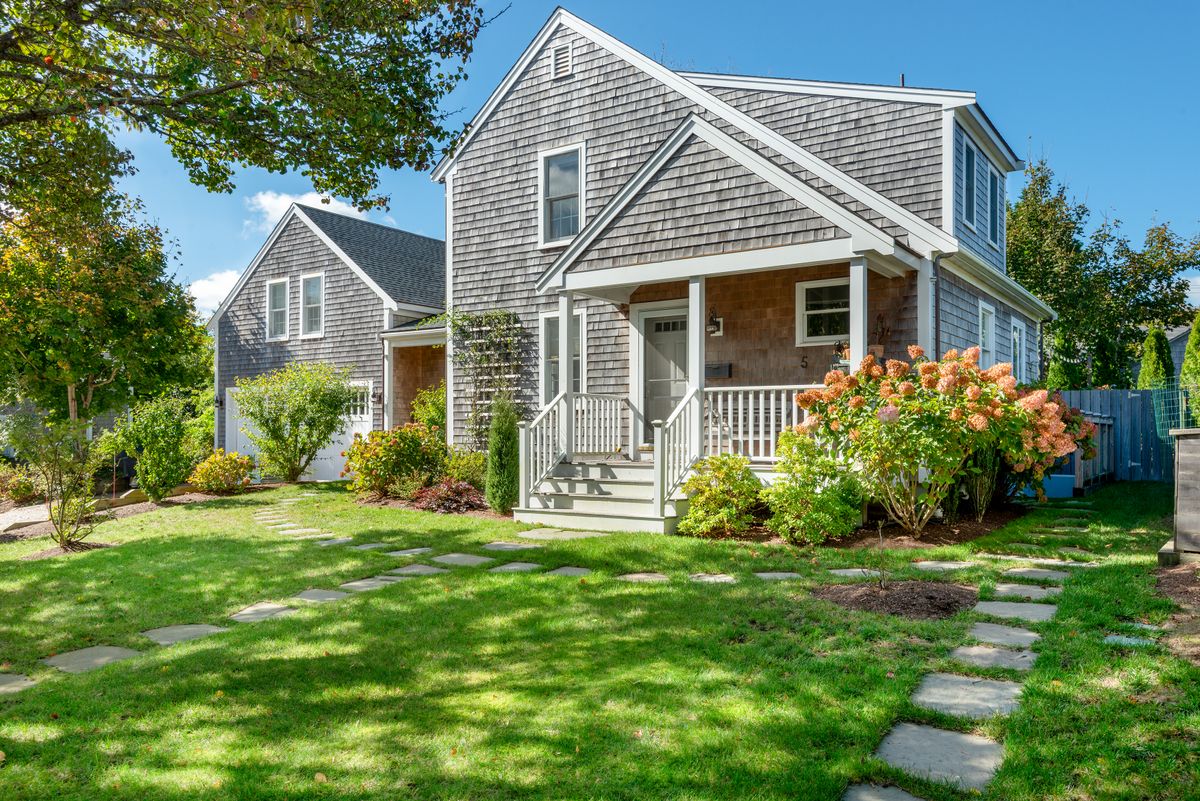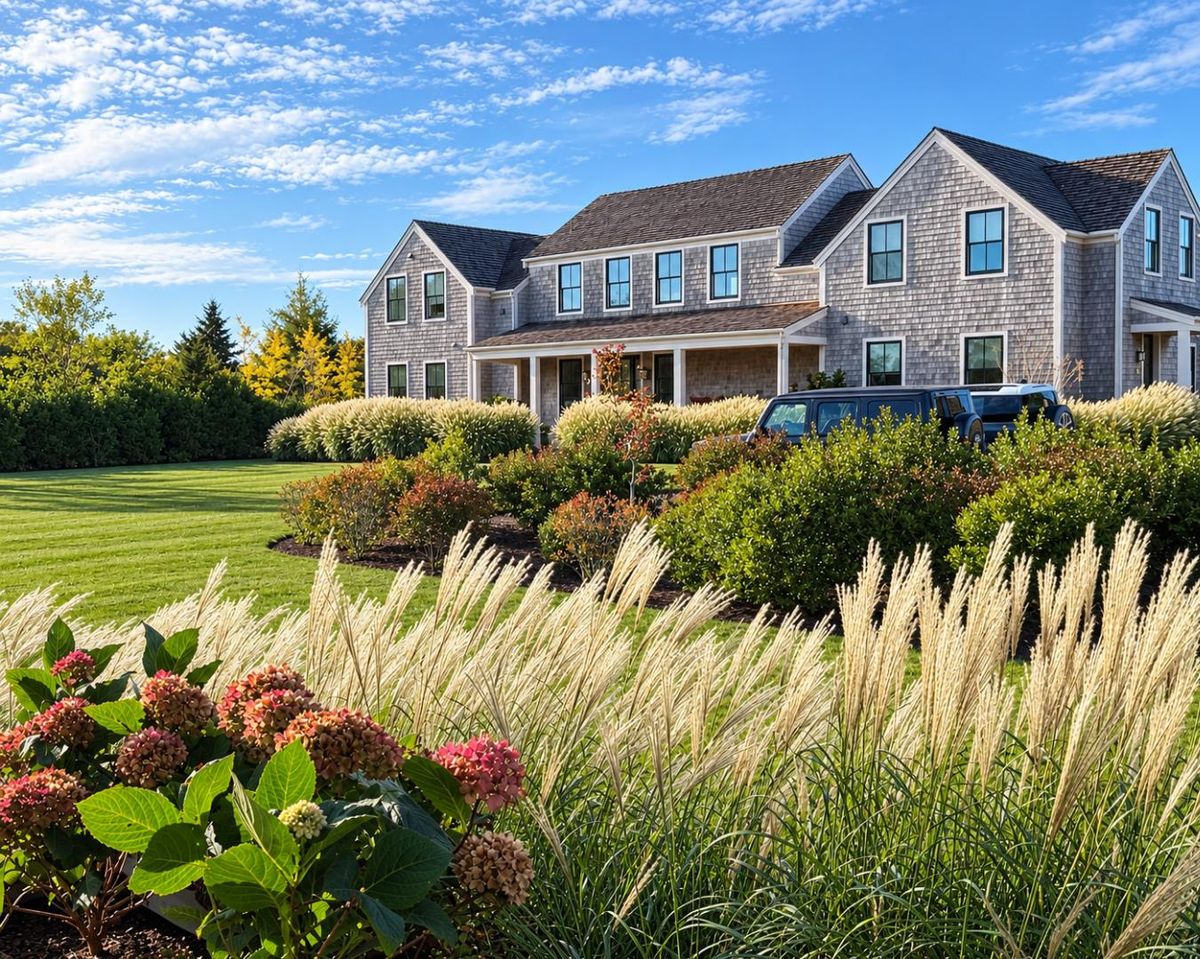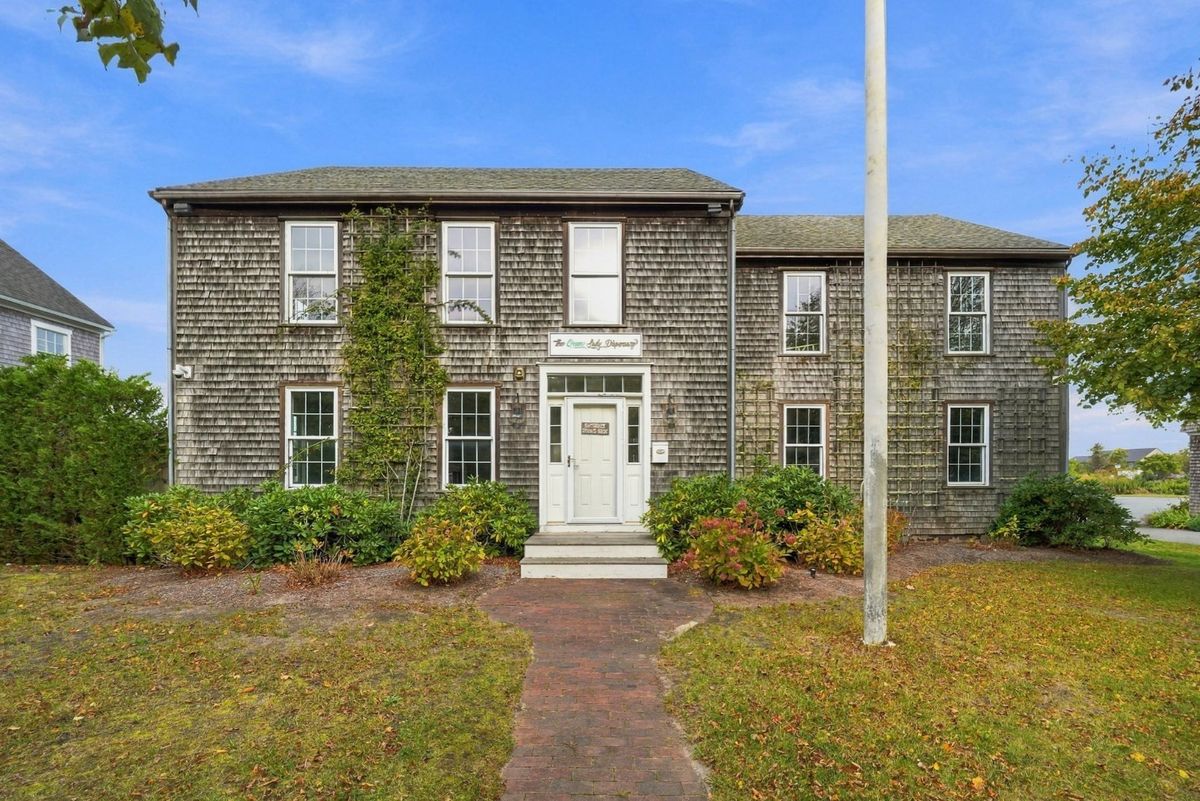
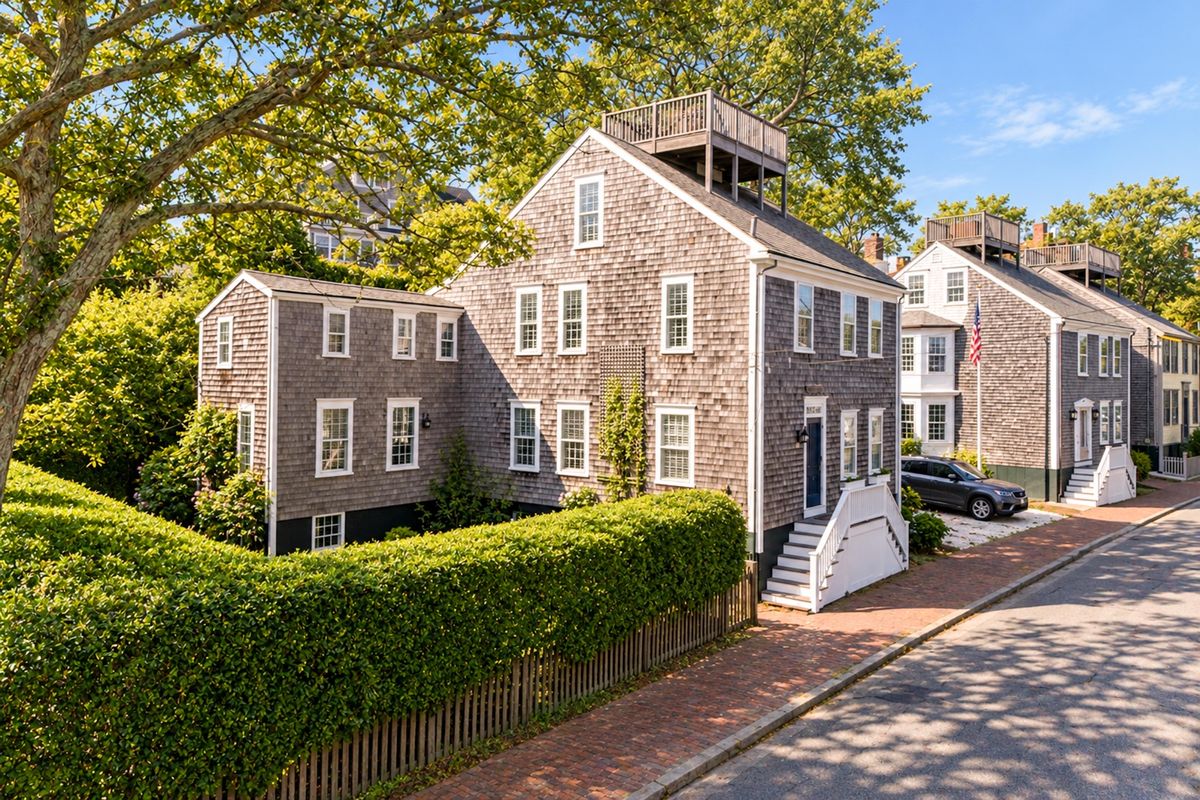
Town- 29 Union Street
Mid Island- 1 Cedar Circle
West of Town- 71 Milk Street
Tom Nevers- 13 Parson Lane
South of Town- 12 Equator Drive
Middle Moors- 1 Middle Tawpawshaw Road
Rely on more than headlines or word-of-mouth commentary by leveraging Fisher Real Estate’s market analytics page, a comprehensive stream of real-time, Nantucket property sales and information.
For a relatively small island 30 miles out to sea, the local market is anything but small. In fact, over the last few years, annual sales volume have ranged from $1.3-$2 billion through 300-700 transactions. Single-family home sales range from $400,000 to $42 million+, with the average sale price around $4.9 million. A market as dynamic as Nantucket’s deserves regular, comprehensive analysis, which you’ll find here on our insights page. From charts and graphs to our monthly and annual reports, we cover the market from all sides. Take a look…
October delivered the highest sale of 2026 as 5 Grant Avenue traded for $35 million, one of five single-family sales above $10 million during the month (this was just recently surpassed with the record sale of 57 Hulbert Avenue in November). October closings included 51 transactions totaling $280 million, the fourth-highest October dollar volume in our data, though short of last October’s record-setting $372 million. Through October 31, 2026, cumulative activity measured 268 transactions totaling $1.23 billion, a respective decline of 22 percent and 18 percent from one year ago, yet just ahead of the five-year average in dollar volume. The median single-family sale price climbed 19 percent to $4.1 million as sales under $2 million continued to dwindle as a percentage of total sales. Meanwhile, new purchase activity slowed to 26 contracts and total inventory held steady at 147 listings. Residential listings were notably lower than one year ago, dropping below 100 listings for the first time since 2021.
Here are Fisher’s October Market Insights…
For the five years preceding 2020, Nantucket real estate activity was largely consistent from year to year. Annual transactions averaged around 450 property sales, totaling near $1 billion in dollar volume. This steady pattern was disrupted during the pandemic peak when transactions skyrocketed from 423 sales in 2019 to 732 sales in 2021 and dollar volume surged handily past $2 billion.
Between 2023-2024, transactions cooled to around 300 annual sales, while property values marginally improved upon their sizable gains from 2021-2022, keeping total dollar volume at impressive figures. The 2025 market marked a reacceleration of activity across the island. Every segment of the market, including residential properties, commercial properties and vacant land, experienced double-digit transaction growth. For the first time since 2021, transactions surpassed 400, approaching pre-pandemic norms.
Let’s dive into the data…
We are dedicated to delivering the most accurate Nantucket real estate market data and the most thoughtful market insights.