Making key real estate decisions in a unique market like Nantucket can be difficult without the most up-to-date market statistics. Understanding price movements and market trends will help you get more value out of your sale or purchase. That’s why at Fisher Real Estate we work to keep our customers and community informed of current and dynamic market information. In addition to our monthly and annual reports, we maintain a set of key market analytics and visualizations on our website that are updated weekly.
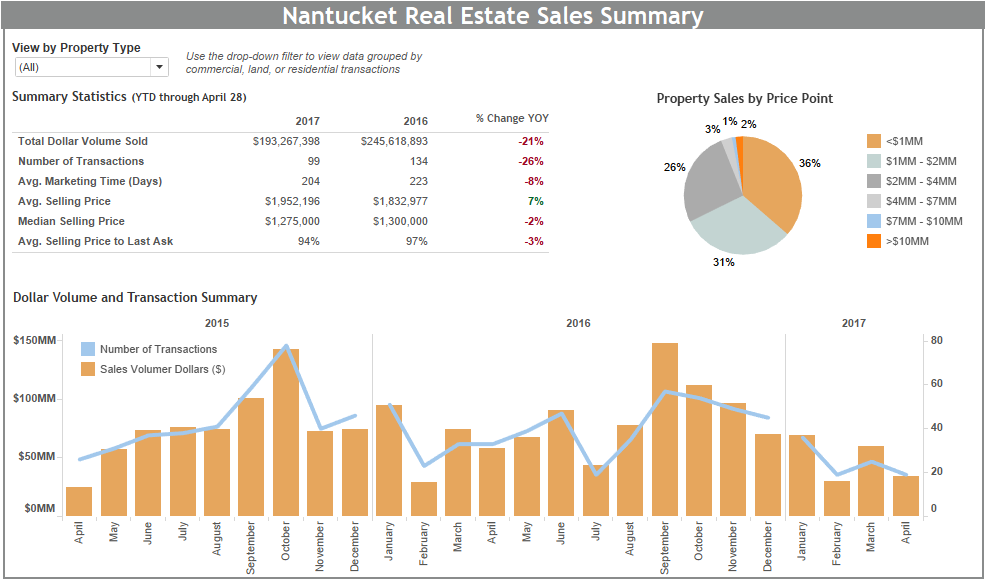
Our market analytics page includes four dashboards. One shows summary statistics for all sales and calculates changes occurring over time. It provides a great concise snapshot of the Nantucket Real Estate market.
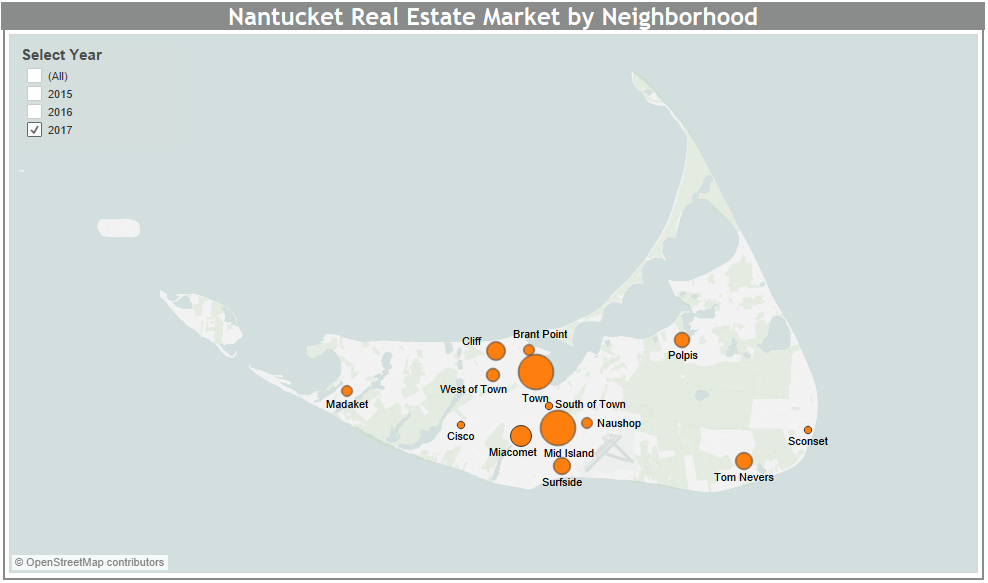
The second dashboard provides a comparison of the key neighborhoods across the island. The size of each neighborhood bubble represents the volume of its sales. Click on each neighborhood to view specific stats like average price, total transactions, and average days on market.
A third dashboard displays a detailed list of all sales which can be viewed by year and month. This is a useful table if you are interested in viewing specific transactions occurring at any moment in time over the last three years.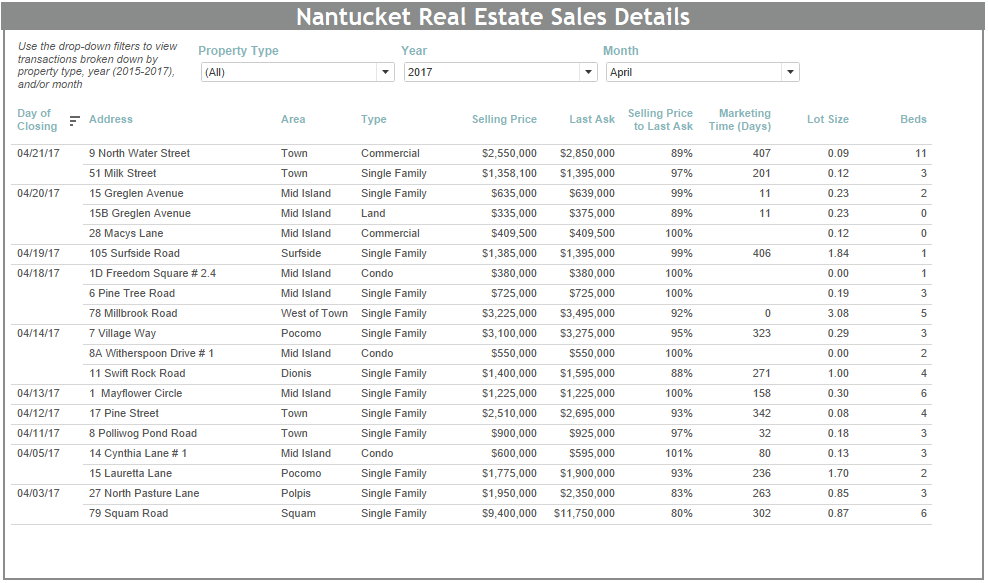
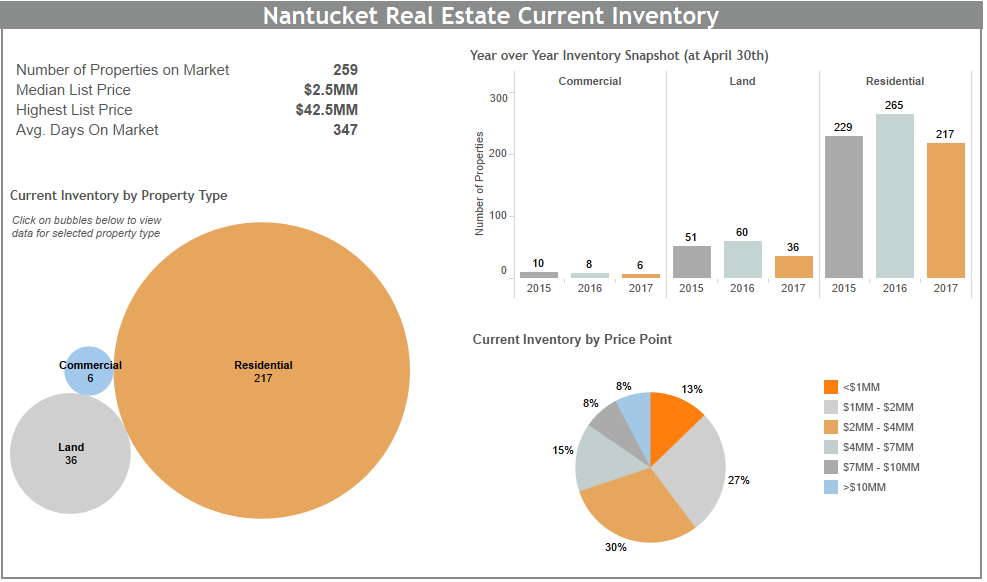
Our fourth dashboard displays summary information about the current inventory of properties listed in the market. This visualization ensures our viewers have immediate access to information on the quantity and quality of properties currently waiting to be sold.
Our data analytics are meant to be interactive. Use the drop-down filters to display a specific subset of data. For example, select ‘Residential’ under Property Type to see how the market is performing for residential homes only. Or select a previous year in the second and third dashboards and watch the data change before your eyes.
![]()
Most important to us is that we provide our clients and community with a picture of how the market is changing over time. It is advantageous to know where the market is going and where it has been in the past. Keep an eye out for the ‘% Change YOY’ column which shows how key stats changed between last year and today. Check out the ‘Dollar Volume and Transaction Summary’ chart to see cyclical trends unique to our vacation market.
![]()
You can stay up to date on the Nantucket Real Estate Market by viewing our analytics page on a weekly basis and signing up for monthly market insights here. We are dedicated to delivering the most accurate market data and best insights because we know that while everyone has access to sales information, not everyone has the ability to help you understand how it may impact you.